Electricity Shoppers Guide
Education about the Market and Products
We energy professionals love to show all kinds of graphs and charts. This page is intended to give the average Texas electricity customer a basic grasp of what all these graphs and charts mean. And in case you were wondering, the charts don’t always mean “Buy Now!,” “Buy from Me Now!,” or “Buy before it’s too late!” I.e. this is not a monster truck ad.
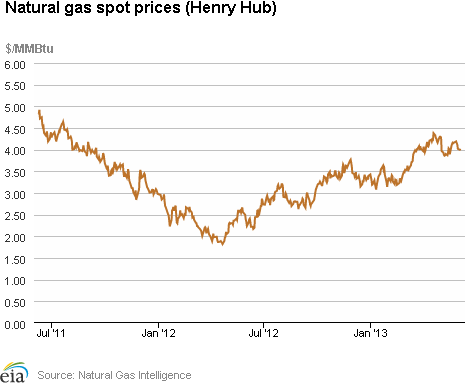
Here is a common graph that you’ll see. This one is taken from the US government’s website www.eia.gov.

Your first question
may be, “This is Natural Gas, what does that have to do with my
electricity contract?”
In Texas, the pricing of Natural Gas (NG) is indicative of what power pricing will be. That is because most Texas Electricity is generated using NG. NG is also more volatile than the other main sources including coal, nuclear, and renewable (their prices don’t go up and down as much). So, this graph is a great graph to predict electricity rates.
Forecasters rely heavily on Natural Gas data like this to make educated guesses on what it will cost to serve your electricity into the future.

Why should I bother?
It is important to develop your own opinion of what the market will do because when all is said and done, you will be the one responsible for paying the terms of your electricity agreement. For example, if you chose a long term contract when the market was high in 2008, you may be disgruntled because you feel you paid too much for too long. But you are the one that agreed to that long term rate at a time when the market was high.
If you talk to us at Transparent EQ, we can give you our best guess. But your opinion counts most as the authorizer of your contract.
![]() Do
you think the price is going to continue to go down, stay about the
same, or go up?
Do
you think the price is going to continue to go down, stay about the
same, or go up?
If you think it’s going to go down or stay the same for a time, you may want to sign a short contract or get on a rate that rides the index of the market. If you think the market is going to go up, you may want to go long to ensure the low prices of today as far into the future as you can.
It’s like a strategy game where the more you know, the better your chance of doing well.
 How
to check the market on a daily basis
Have you ever heard a salesman say “Now is always a good time to buy!” ...Well, it isn’t!
Timing is critical in Electricity Contract decisions. In fact, this concept is almost cliché in the Energy Advisor world: “Timing is key”, “Timing is the critical element”, or “Take advantage of market movement.”

Because there are times when it is very expensive to buy electricity.
Seasonality
During extended summer heat or during a winter freeze are good examples of when prices typically rise. It is also common to see that it is less expensive to buy during spring and fall because there is little demand for electricity. This concept is called seasonality depicted by the usage graph below.

This graph shows a typical usage pattern for a home in Texas. The times of high usage are common for not only this example, but for all premises across the state. So, demand for KwH is typically much higher in Summer and Winter, therefore prices typically go higher in Summer and Winter.
Spring and Fall are then considered the better times to buy. “Shoulder months” is an industry term for these seasons. Why? We don’t know for sure, but it’s been said that if the graph were a picture of people’s faces, their shoulders would be the spring and fall months!
Future Prices
If you were a gold seller, and a customer asked you to sign a contract to sell him gold five years from now at today’s prices, would you do it? Probably not. You would probably tell the customer that gold has gone up x% in the past 5 years and that you would expect him to contract to pay more to buy it in the future.
But what if gold had been going down for 5 years and forecasters agreed that it will go down more? Then you might be very eager to agree to the customer’s proposal, but it would be risky. So, you might want to charge a little premium to make sure you don’t go broke.
It is exactly the same when you sign your electricity contract for several years or sign a contract far in advance of the start date. Uncertainty causes risk premiums which increase your rates.
Graphing the Combo

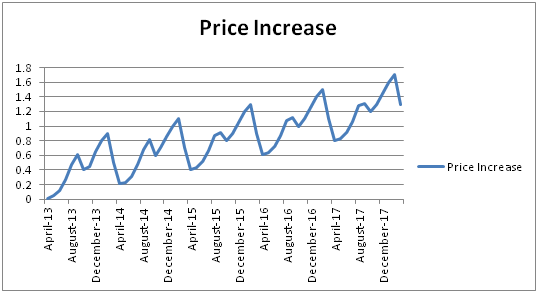
This chart is a guesstimate of how many cents/Kwh of extra risk premiums you can expect to pay to lock in your rate through any particular end date. Notice how it is much more attractive to end your contract in the shoulder months of April or October. Also notice that in general, the farther you go into the future the higher the price increase.
The upwards wave of increased risk premiums on this chart have an energy industry term: “Contango.” Educated electricity shoppers understand the Contango that they are paying to minimize future risk, ie. lock in a rate. Paying a penny extra to lock in your rate for 2.5 years is a great idea if budgets are tight and price increases could cripple an organization. But if every penny on a rate is a $25,000 difference, it may be wise to avoid all risk premiums possible by signing shorter term contracts or riding the index.
While the graph above is a good indication of Contango costs, the increases do change constantly with the market. Sometimes Contango disappears! This happens when the price for electricity far in the future actually becomes less than the price for the current year. In those times, the market is called a Backward Dated market. A Backward Dated market often indicates that current year prices are exaggeratedly high.
Index Pricing is a wholesale rate that rides the market. Historically, index rates have been less cost over time than fixed rates. However, since this rate rides the market, price spikes often occur. The rate may be 12 cents per KwH one month and 2 cents/Kwh a few months later. This fluctuation has historically averaged out to being less than fixed rates because there is no Contango, or risk premiums.
So, the question that needs to be asked is: “Could your business easily handle an increase of double or triple on your electric bill for a short time, or would it be a strain?” Other ways this question is asked are “How is your cash flow?” or “Do you have excess capital?” If an energy professional has asked you those questions, it was likely not to get in your wallet, but to understand your appetite for risk. (At least, we would hope!)
Index products are contracted just like fixed terms to avoid added premiums for the risk of a customer switching away. In that way, index rates differ from a typical Month to Month rate. Month to Month rates are often high due to the likelihood of a customer switching away.
 How
to check the market on a daily basis
If you’re wanting to check the market daily to decide for yourself when
to sign your next electricity contract, there are two public access
websites that can be very useful.
http://www.eia.gov/naturalgas/weekly/
&
http://www.cmegroup.com/trading/energy/natural-gas/natural-gas.html
The EIA site will give you a bird’s eye view at what Natural Gas has been doing over the past months & years. The CME Group link will give you what the price is doing today in real time.
It may be helpful for you to know that Henry Hub is just a Meter on a gas pipeline in Louisiana. But that metering point is a basis for trade, measuring supply, and forecasting of pricing. You can use the data to determine if energy prices have risen or fallen in the last day, hour, or 15 minutes.
Just ask!
Contact Us
If you did take the time to read our site, we would like to say Thank You! The more educated we are as consumers, the better the economy becomes for everyone.


